Fixed-interval preventive maintenance made sense when sensors were expensive and data analysis required a statistician. Neither of those things is true anymore. Yet most discrete manufacturers I talk to are still running PM schedules built on OEM recommendations from the early 2000s, adjusted maybe once when they switched CMMS platforms. The math on why that's worth changing is more straightforward than most finance teams expect.
What You're Actually Paying For With Time-Based PM
Preventive maintenance isn't free. Every scheduled intervention costs labor hours, parts, and planned downtime — whether or not the machine needed the work. In our experience reviewing maintenance logs from mid-size US facilities, somewhere between 30% and 40% of completed PMs find no measurable defect at the time of intervention. The machine was fine. The parts were replaced on schedule because the schedule said to replace them, not because condition data indicated wear.
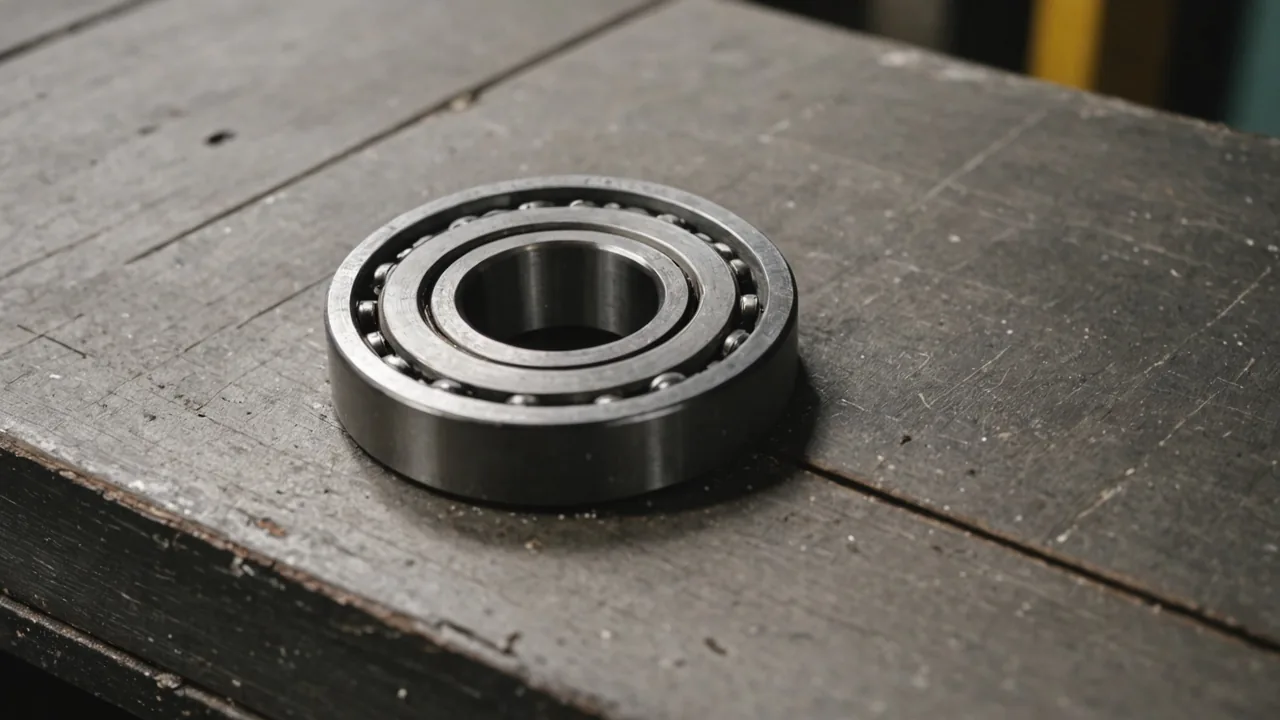
That over-maintenance cost compounds in two ways. First, the direct cost: technician time, parts consumption, and the planned production interruption to execute the PM. A typical bearing replacement on a mid-size motor runs $400–$800 in parts and 4–6 labor hours at industrial wage rates — call it $1,200–$1,800 per event including indirect costs. If 35% of your annual PM work orders were unnecessary, that's real money leaving the budget without a corresponding reliability benefit.
Second, and often overlooked: every time you disassemble a well-functioning machine, you introduce infant mortality risk. Assembly errors, contamination, and improperly seated components after a PM are a leading cause of premature failure in the 2–4 weeks following scheduled maintenance. Reliability engineers call this the "PM dip" — a measurable uptick in failures immediately post-intervention that shows up in MTBF data if you know to look for it.
The Reactive Tail: Where the Real Cost Lives
On the other side of the ledger, unplanned failures are expensive in ways that rarely show up fully in a plant's maintenance budget. The direct cost is easy to count: emergency labor, expedited parts at a 40% premium over planned procurement, and the downtime duration to diagnose and repair. At $20,000–$80,000 per hour of unplanned downtime — a range we've seen consistently across automotive and metal fabrication facilities — even a two-hour failure event on a production-critical asset is a significant loss event.
The harder costs to capture are what happens downstream. A stamping press that trips unexpectedly doesn't just lose its own production time — it starves the downstream assembly cell, creates work-in-process inventory problems, and may force overtime on other shifts to recover schedule. When we work with facilities to build their full downtime cost model, the total figure is typically 1.4–2.1x what the maintenance team initially reports, once production and quality impacts are folded in.
"The maintenance budget is the line item. The production budget is where the failure actually costs you. Most ROI calculations only look at one of the two."
— Lukas Reinhardt, CEO & Co-Founder, Gearcadence
A Framework for Calculating Your PdM ROI
Before committing to a condition-monitoring program, you need a number. Here's the calculation framework we walk prospective customers through, using inputs they can pull from their existing CMMS and production data.
Step 1 — Quantify current reactive failure cost. Pull the last 12 months of unplanned downtime events from your CMMS. For each event: duration × hourly throughput value × OEE impact factor. Add emergency parts costs (typically 40% over catalog price) and emergency labor premiums. Most facilities find this number is $300,000–$1.2M annually for a 100–300 asset facility.
Step 2 — Estimate PM over-maintenance cost. Take total PM work orders completed, multiply by your average PM cost, then apply a conservative 25% "unnecessary work" factor. This is the cost of maintaining equipment that didn't need maintenance.
Step 3 — Model the PdM scenario. A working predictive maintenance program typically reduces unplanned failure events by 50–70% on instrumented assets in the first 18 months. Apply that reduction to your Step 1 number. Then model PM interval extension: condition-based scheduling typically reduces PM frequency by 20–35% on well-monitored assets.
Step 4 — Subtract PdM program cost. Include sensor hardware, platform subscription, and technician time for alert response. Divide the net benefit by program cost for your ROI ratio.
In the facilities we've worked with, first-year ROI typically falls in the 3:1–6:1 range for assets where vibration and temperature signatures provide early warning lead time of 48–96 hours. That lead time is what makes the math work — it's enough time to schedule planned corrective work rather than scrambling for emergency parts on a Saturday afternoon.
Which Assets Move the Needle
Not every machine in your facility is a good predictive maintenance candidate. The ROI model above changes dramatically based on three factors: failure consequence severity, failure mode detectability via sensor data, and replacement lead time.
Rotating equipment — motors, gearboxes, pump assemblies, fans — is where vibration-based PdM consistently delivers. These assets produce clear spectral signatures as bearings degrade, as alignment shifts, and as gear mesh patterns change. Early detection windows of 48–120 hours are achievable. That's long enough to order parts, schedule a technician, and plan a maintenance window without production impact.
Assets with short failure-to-catastrophe timelines and high replacement cost — servo drives, precision spindles, hydraulic power units — are the highest-priority candidates. A hydraulic power unit that costs $45,000 to replace and takes three weeks on a lead time is exactly the asset where a $300/month monitoring investment looks like cheap insurance.
Assets that are inexpensive to replace and fail with minimal consequence are better left to run-to-failure or tightened PM schedules. The goal isn't to instrument everything — it's to instrument the right things.
Why the Comparison Usually Favors PdM More Than Expected
When maintenance managers first see the ROI model, they often underestimate the PM over-maintenance figure. They're used to thinking of PM as "doing the right thing" — preventive care that protects the asset. What the data actually shows is that fixed-interval PMs are a blunt instrument applied to a highly variable problem. Machine degradation depends on load, environment, operating temperature, and hundreds of other factors that vary across shifts. A 90-day PM interval calibrated for average conditions over-maintains half the fleet and under-maintains the other half at any given point in time.
Condition-based scheduling doesn't eliminate PMs. It doesn't require you to abandon your existing maintenance program or your CMMS. What it does is give each PM interval a real signal to respond to rather than a calendar date. An asset running clean at 90 days gets pushed to 120. An asset showing early anomaly signatures at 60 days gets pulled in early, before it becomes an unplanned event.
We built Gearcadence specifically for the mid-size US discrete manufacturer who doesn't have a full-time reliability engineer or a team of data scientists on staff. The platform does the signal analysis and surfaces ranked work orders — maintenance teams get the output, not the analytical burden. The ROI math works whether you're running SAP PM, IBM Maximo, or Fiix; the work orders land directly in whatever system your technicians already use.
Making the Case to Finance
The hardest part of a PdM business case isn't usually the math — it's getting finance to accept "avoided cost" as a line item. Money you didn't spend on emergency parts doesn't show up in a budget variance. Downtime you didn't have doesn't appear in a production report.
The Gearcadence ROI tracker module addresses this directly. Every time the system surfaces a predictive alert and a maintenance team completes planned corrective work, the event is logged with the asset, the failure mode prediction, the actual repair performed, and an estimated production-loss cost avoided. After six months, you have a documented record of specific failure events the program caught — not a theoretical model, but actual averted failures with timestamps, work orders, and cost estimates.
That's the format that resonates with plant directors and operations VPs: not "we believe we're avoiding X dollars of downtime," but "here are the 14 failure events we caught before they tripped, here's what each one would have cost, and here's the total avoided cost for the quarter." Concrete cases built from your own facility data are more convincing than any benchmark study.
The shift from preventive to predictive maintenance isn't a technology bet. It's a measurement problem — and measurement problems have solutions. Start with your highest-consequence rotating equipment, build the cost model using your own CMMS data, and pilot on four or five assets before scaling. The ROI case tends to strengthen as the model learns your specific equipment, which is why early movers build a compounding advantage over facilities still running on calendar-based intervals alone.